Symbols Worksheet
NAVIGATING A NEW DEMOGRAPHIC | GAUGING VISUAL UNDERSTANDING
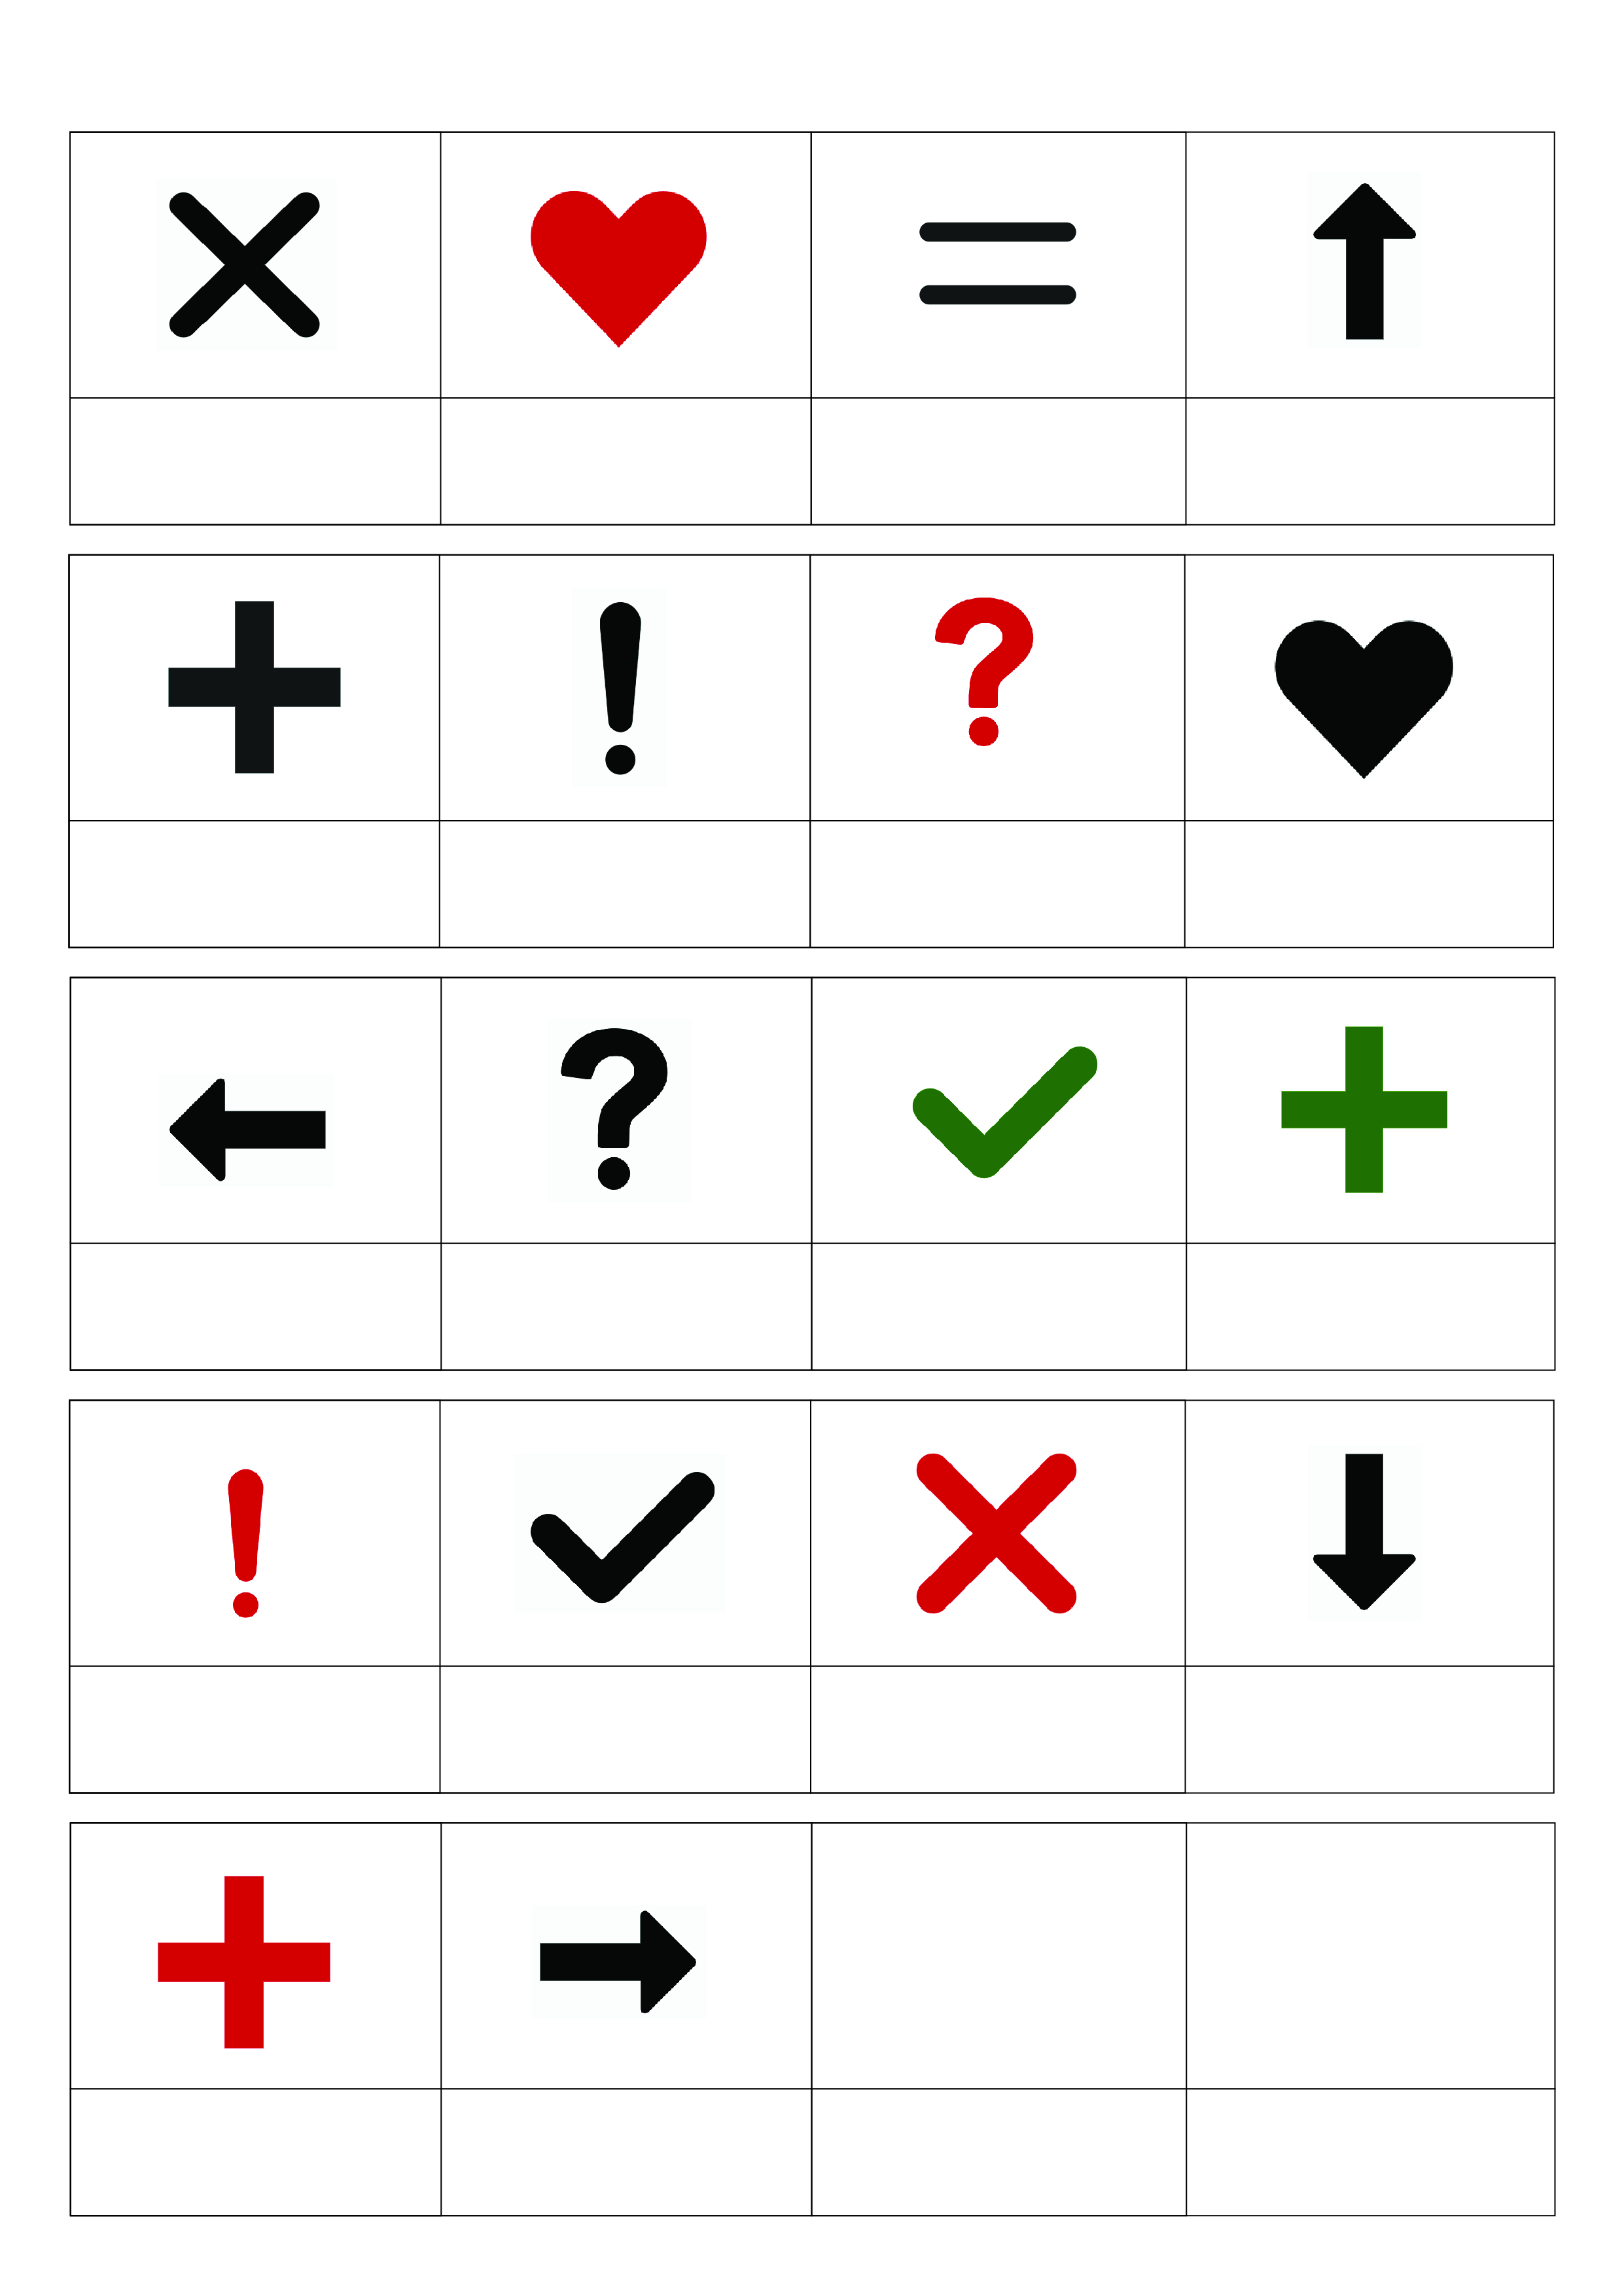
The symbols worksheet is a tool designed to gain insight into the target audience's understanding of symbols that are considered to be commonly used in written communication.
We selected a few symbols and created a worksheet with them with space for the participant to respond to each symbol. We handed out these sheets to individuals and asked them to write down what they associated with each symbol or, if they did not feel comfortable writing, to tell us what each symbol meant to them so we could write down their responses.
When trying to gauge the visual understanding of a new demographic, this activity can serve as a good entry point to begin the inquiry. As it is aimed at understanding the target audience’s understanding of communication symbols that we consider absolutely basic, it can help the researcher let go of previous assumptions and gain perspective on what the audience themselves finds ‘obvious’ or ‘basic’. This learning can then inform the way forward in conducting more research.
This data can also help the researcher find out the kind of visuals that are commonly consumed by the target audience, and the way in which that happens.
For example, during our research, the owner of a small eatery who Vedika interacted with recognized the arrow as a symbol for 'downloading media' and the green tick as a symbol for ‘message sent’, indicating that he was relating the symbols to the ones he saw on his phone on a daily basis.
However, one of the most useful insights that we gathered from this activity was from a large number of participants being confused or hesitant while answering even when it seemed that they had the correct answer in their minds. It helped us realize that the fact that these symbols were placed on the worksheet without any context influenced the responses a great deal. We could note that it was probably this lack of context that led to some of the wrong answers. This insight was then taken forward when we developed the rest of our research tools, and we were thus able to create activities that yielded richer data about our audience's visual understanding.